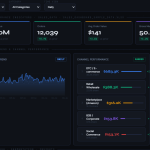
This is an example of visualizing a multi-page finance analytic dashboard to help executives decision-making. This dashboard features:
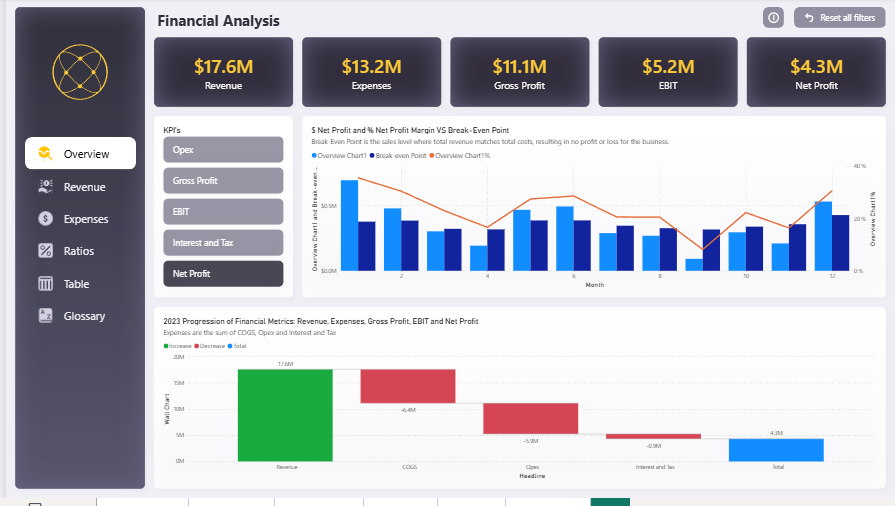
Example of Finance Analytic Dashboard using Power BI

Recent Categories
Recent Posts
- Story of an exploratory analysis led to UI/UX changes that increased revenue from crypto token swap transactions
- Example of Finance Analytic Dashboard using Power BI
- Building a “DOI needle mover” that helped Inventory Management decision-making in the biggest hospitals group in Indonesia
- Example of quick and reusable Gen-AI sales dashboard with insights generation
- From Chaos to Control — Transforming a Garment Manufacturing Operation