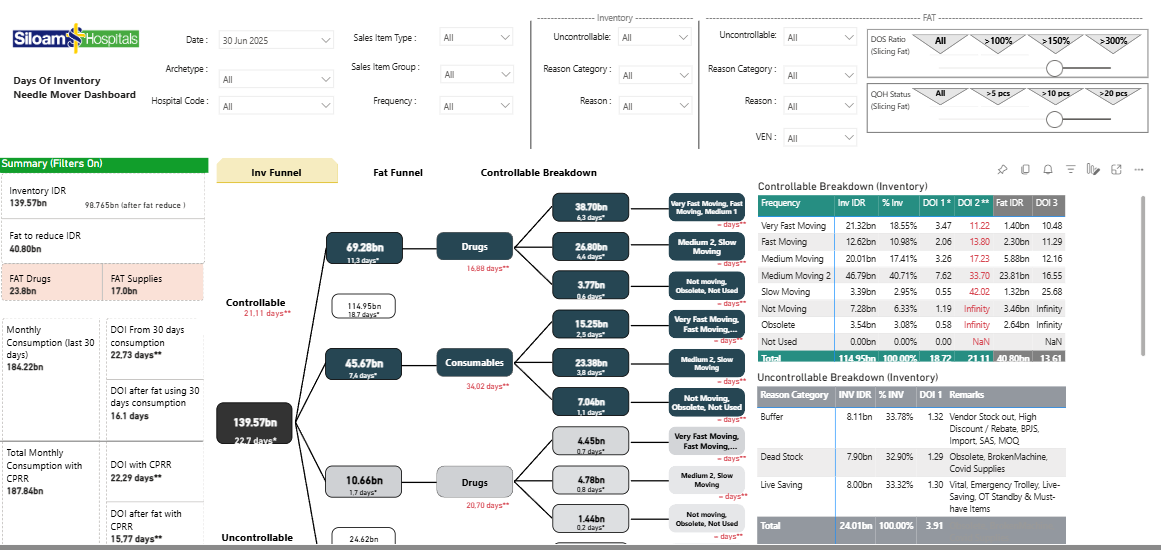
I successfully led the end-to-end development of an Analytics Dashboard that enabled the Supply Chain Management team to strategically reduce overall Days of Inventory (DOI). The initiative was driven by the need to improve working capital efficiency while maintaining service levels.
1. Design & Requirements Gathering
I began by conducting structured discussions with stakeholders across Supply Chain, Planning, Procurement, and Finance. The goal was to clearly understand their pain points related to high DOI, excess stock, slow-moving items, and replenishment inefficiencies.
From these sessions, I translated business questions into measurable analytics requirements—defining KPIs such as DOI by product category, plant, supplier, and demand variability patterns. I also identified the need for drill-down capabilities to move from enterprise-level metrics to SKU-level insights.
2. Data Modelling
Next, I designed a robust data model integrating data from ERP systems, inventory transactions, demand forecasts, procurement lead times, and sales history.
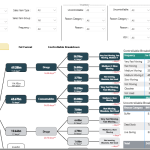
I structured fact tables for inventory balances and movements, linked with dimension tables for product hierarchy, location, time, and suppliers. This ensured accurate DOI calculations and supported multi-dimensional analysis.
3. Design Finalization
After building initial prototypes, I conducted review sessions with key stakeholders. Their feedback helped refine dashboard layout, KPI definitions, and filtering logic.
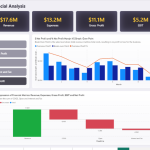
We prioritized clarity and decision-readiness—ensuring executives could quickly see high-level DOI trends, while planners could drill down into root causes.
4. Data Modelling Finalization
I optimized the data model for performance and scalability. This included refining relationships, indexing strategies, and validation checks to ensure data accuracy.
I also implemented logic to standardize DOI calculations across different inventory categories (Drugs, Consumables, Medical Supplies, Others), ensuring consistent interpretation across departments.
5. BI Functions & Visualization Development
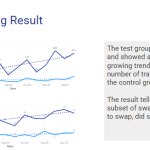
Using BI tools, I developed interactive visualizations that highlighted:
– DOI trends over time
– Slow-moving and excess inventory identification
– Supplier lead time variability impact
– ABC classification insights
– Inventory aging analysis
I incorporated advanced functions such as dynamic filtering, drill-through capabilities, and scenario-based views to allow users to simulate the impact of changes in demand or replenishment cycles.
6. Functions & Visualization Testing & Revision
I conducted multiple rounds of UAT (User Acceptance Testing), validating both data accuracy and usability.
During this phase, I refined calculations, improved visual clarity, adjusted performance bottlenecks, and simplified navigation based on real user interaction patterns. This iterative refinement significantly improved user adoption.
7. Project Finalization
Once validated, I finalized documentation, conducted training sessions, and rolled out the dashboard organization-wide.
The result was a data-driven decision framework that empowered the Supply Chain team to identify:
High DOI contributors by SKU and location
Demand-forecast misalignment
Procurement inefficiencies
Excess safety stock levels
As a result, the team was able to strategically reduce overall DOI while maintaining service levels, improving cash flow, and increasing inventory turnover.
1. Design & Requirements Gathering
I began by conducting structured discussions with stakeholders across Supply Chain, Planning, Procurement, and Finance. The goal was to clearly understand their pain points related to high DOI, excess stock, slow-moving items, and replenishment inefficiencies.
From these sessions, I translated business questions into measurable analytics requirements—defining KPIs such as DOI by product category, plant, supplier, and demand variability patterns. I also identified the need for drill-down capabilities to move from enterprise-level metrics to SKU-level insights.
2. Data Modelling
Next, I designed a robust data model integrating data from ERP systems, inventory transactions, demand forecasts, procurement lead times, and sales history.
I structured fact tables for inventory balances and movements, linked with dimension tables for product hierarchy, location, time, and suppliers. This ensured accurate DOI calculations and supported multi-dimensional analysis.
3. Design Finalization
After building initial prototypes, I conducted review sessions with key stakeholders. Their feedback helped refine dashboard layout, KPI definitions, and filtering logic.
We prioritized clarity and decision-readiness—ensuring executives could quickly see high-level DOI trends, while planners could drill down into root causes.
4. Data Modelling Finalization
I optimized the data model for performance and scalability. This included refining relationships, indexing strategies, and validation checks to ensure data accuracy.
I also implemented logic to standardize DOI calculations across different inventory categories (Drugs, Consumables, Medical Supplies, Others), ensuring consistent interpretation across departments.
5. BI Functions & Visualization Development
Using BI tools, I developed interactive visualizations that highlighted:
– DOI trends over time
– Slow-moving and excess inventory identification
– Supplier lead time variability impact
– ABC classification insights
– Inventory aging analysis
I incorporated advanced functions such as dynamic filtering, drill-through capabilities, and scenario-based views to allow users to simulate the impact of changes in demand or replenishment cycles.
6. Functions & Visualization Testing & Revision
I conducted multiple rounds of UAT (User Acceptance Testing), validating both data accuracy and usability.
During this phase, I refined calculations, improved visual clarity, adjusted performance bottlenecks, and simplified navigation based on real user interaction patterns. This iterative refinement significantly improved user adoption.
7. Project Finalization
Once validated, I finalized documentation, conducted training sessions, and rolled out the dashboard organization-wide.
The result was a data-driven decision framework that empowered the Supply Chain team to identify:
High DOI contributors by SKU and location
Demand-forecast misalignment
Procurement inefficiencies
Excess safety stock levels
As a result, the team was able to strategically reduce overall DOI while maintaining service levels, improving cash flow, and increasing inventory turnover.

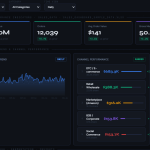
Dashboard Features: